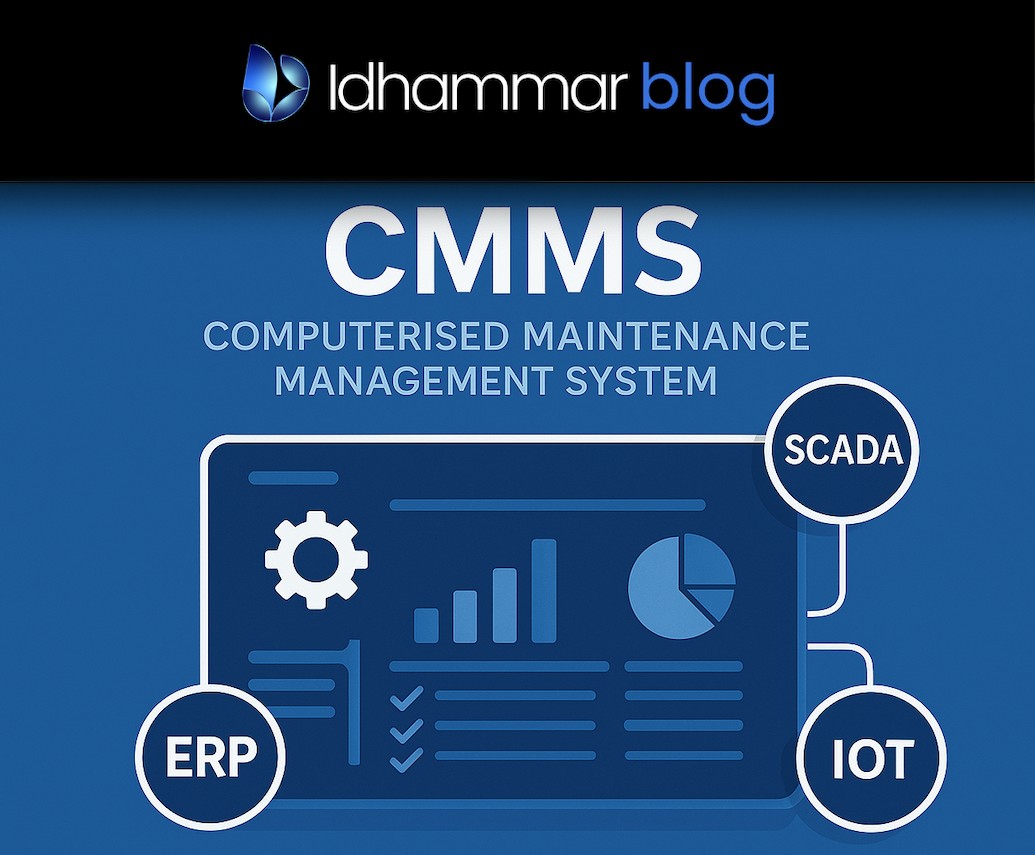
Computerised Maintenance Management Systems (CMMS) have become indispensable tools for modern asset management operations, helping to streamline workflows and ensure optimal equipment performance.
CMMS software is also the key to strategic decision making. The wealth of data that your operations generate is a great source of guidance on the path of continuous improvement, so having robust analytics features is crucial.
Analytics is also necessary for implementing preventive maintenance scheduling and predictive maintenance (according to Deloitte, the latter can increase equipment uptime by as much as 20%).
So, what analytics features should your maintenance software should have to maximise efficiency and minimise downtime? Read on to find out.
1. Real-Time Dashboards and Visualisations
One of the most critical features of any CMMS software is real-time dashboards that provide up-to-the-minute data on maintenance operations, equipment performance, and overall plant health.
These dashboards typically include a variety of widgets that display key metrics and indicators. For example, you can monitor work order statuses, track the number of open versus closed tasks, and observe real-time equipment performance metrics.
One of the key advantages of these dashboards is that they provide a quick, visual snapshot of a large data pool. If you have a lot of assets, for example, you can see which ones need the most work and which may be costing your business in repairs and labour.
In other words, maintenance managers can quickly get an overview of asset health and other crucial information without having to sift through lots of data. From there, they can make quick, informed decisions, respond to issues as they arise, and ensure that operations run smoothly.
Customisation
The ability to customise these dashboards ensures that each user sees the most relevant data for their role. Whether it’s a maintenance manager, technician, or executive, dashboards provide a snapshot of current conditions, helping maintenance teams stay proactive and responsive.
Intuitive Data Visualisations
Another benefit of using dashboards is the fact they use data visualisation to make complex information more understandable and actionable.
Intuitive charts and graphs allow users to quickly grasp trends and outliers in a fraction of the time it would take otherwise. In fact, research from the University of Minnesota states that the human brain processes visual information 60,000 times faster than text, while MIT states that the brain processes an image in as fast as 13 milliseconds.
2. Tailored KPI Dashboards
While real-time data is essential, the ability to track the most relevant Key Performance Indicators (KPIs) for your operations is equally important.
Tailored KPI dashboards therefore enable users to monitor critical metrics such as asset maintenance codes, labour efficiency, and asset utilisation, providing a deeper understanding of how well maintenance processes are functioning and where improvements are needed.
For example, tracking the cadence of created versus completed work orders provides insights into the efficiency of your maintenance team. Are work orders being completed in a timely manner, or is there a backlog that needs addressing?
Similarly, monitoring resource loading helps ensure that your team is optimally allocated, preventing both underutilisation and overburdening of staff.
Asset performance and cost tracking are also vital components of these dashboards. Understanding how each asset is performing and the associated maintenance costs allows for better budget management and asset lifecycle planning.
3. Interactive Drill-Down and Data Slicing
Complex maintenance data often requires a more in-depth analysis to uncover hidden insights and trends. Interactive drill-down and data slicing features allow users to explore these complex datasets thoroughly – yet intuitively.
With these capabilities, you can start with a high-level overview and progressively drill down into more detailed information. For example, a high-level dashboard might show overall equipment downtime and by probing further, you can identify which specific machines are causing the most downtime, what types of failures are occurring, and the root causes of these failures.
This granular level of analysis helps identify actionable insights that can lead to significant improvements in maintenance practices.
Data slicing further enhances this capability by allowing users to filter and segment data based on various criteria. Whether you’re looking to compare performance across different time periods, equipment types, or maintenance teams, data slicing makes it easy to isolate the variables you’re interested in.
This flexibility is crucial for tailoring analyses to meet specific investigative needs and uncovering insights that might otherwise be missed.
4. Seamless Integration with Other Software
Maintenance operations do not exist in a vacuum; they are interconnected with various other business functions, such as finance, procurement, and production. To provide a comprehensive view of operations, your Computerized Maintenance Management System should therefore seamlessly integrate with other business systems and data sources.
For example, integrating with your finance or enterprise resource planning system can allow you to compare maintenance budgets with actual asset costs, which enables more accurate financial planning and ensures that maintenance spending aligns with overall budgetary goals.
Likewise, integrating with procurement or inventory management systems can streamline the parts and materials ordering process, reducing downtime caused by waiting for necessary components.
Integrations like these bring all relevant information into one consolidated view, making it easier to track performance and make informed decisions. They also eliminate the need for manual data entry, which reduces the associated risk of errors when transferring data between systems.
5. Always Available Reporting
Always available reporting ensures that key stakeholders can access important data whenever they need it, without delays. This feature is essential for keeping everyone informed and aligned, from maintenance teams to senior management.
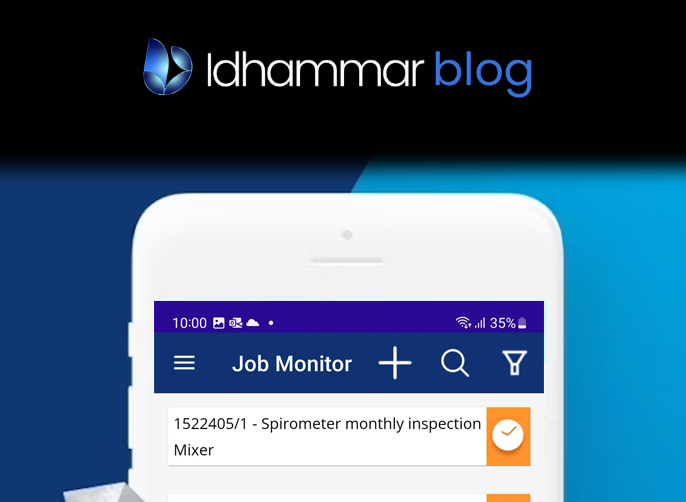
The reports can be presented in several formats; there are online reports that can be run in a web browser, mobile apps that provide access on the go, and scheduled snapshot reports that are sent to a list of recipients at specific times i.e., to the engineering team or management teams before shift handovers or meetings.
This constant availability maintains transparency, keeps all team members on the same page, and enables quick decision-making and responses.
Conclusion
Having robust analytics features in your Computerized Maintenance Management Software is crucial for ensuring equipment reliability and efficient maintenance activities on the whole.
To summarise, the top five features you should look for include are real-time dashboards, tailored KPI tracking, interactive drill-down capabilities, the ability to integrate with other business systems, and always-available reporting.
These features fuel the shift from a reactive to a proactive approach, addressing issues before they become critical and saving costs in the process.
Our world class maintenance management solutions integrate with Microsoft Power BI to provide our customers with this advantage. To learn more or request a demo, contact us today.


